
Voyager Data Overview
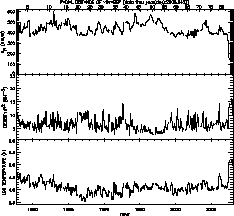
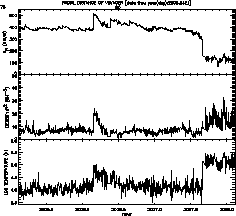
These plots show 50-day averages of the solar wind speed, density, and temperature over the life of the Voyager mission (from 1977 to the present), and 1-day averages over the last three years, respectively. The density shown is normalized to Earth by multiplying by the distance to Voyager in AU squared.
Speed plots
These plots show hourly averages of the solar wind speeds measured by Voyager 2 over the last 500 and 100 days, respectively.
Voyager 2 Solar Wind Dynamic Pressure
These plots show hourly averages of the solar wind dynamic pressure observed by Voyager 2 over the entire mission (100-day averages) and over the last four years (25-day averages), respectively. These pressures are normalized to 1 AU by multiplying by the square of the spacecraft's distance.