This section contains recent interesting events observed by the Voyager 2 plasma experiment in the solar wind.
Energy-time spectrograms showing velocity jumps or plasma structure plots observed on the dates listed below are available.
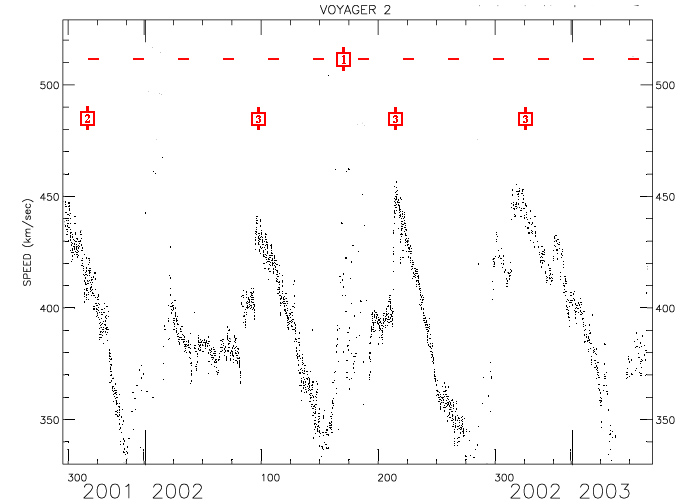
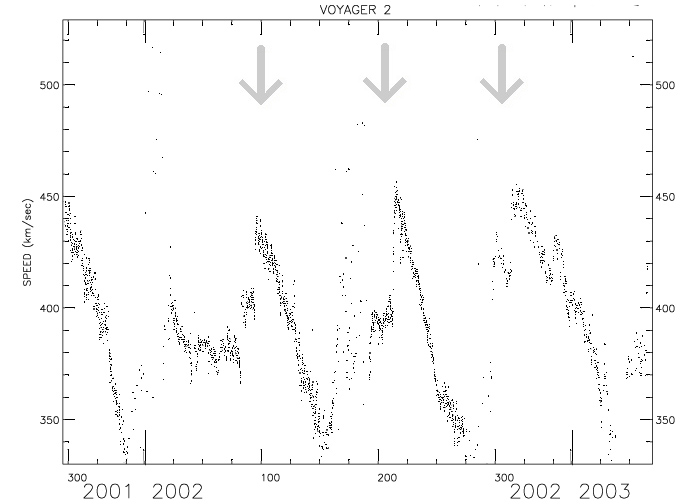
Event 1: July, 2001 - [at least] February, 2003
Event 3: Merged Interaction Regions (MIRs), 2002
Event 4: Bastille Day 2000 Propagation
Event 6: October - November, 2000
Event 9: March 10 - 16, 1998 (day 069 - 075)
Event 11a: September 15 - 20, 1997 (day 258 - 263),
Event 11b: July 9 - 23, 1997 (day 190 - 204)
Event 12: February 18, 1997 (day 49)
Event 13: August 6 - October 18, 1996 (day 219 - 292)
Event 15: September 23 - 25, 1995 (day 266 - 268)
Event 16: March 16, 1995 (day 75)
Event 17: January 21, 1995 (day 21)
Event 18 June 30, 1994 (day 181)
Event 19: March 12, 1994 (day 71)
The solar wind density and speed have evolved into a new regime where they are strongly correlated (high speed regimes are also high density regions). This solar wind behavior is very different from near the Sun, where high speed wind usually has low densities. This new regime results in large pressure changes, which can push the termination shock outward.
This is the largest speed increase seen at Voyager since 1989. We think it is caused by a series of coronal mass ejections which were observed near Earth in April of 2001 and which have merged together to form one big event at Voyager.
Shown are (top) solar wind speed and (bottom) thermal pressure of 192-second high-resolution data. (Wang and Richardson, Geophys. Res. Lett. 29, 10.1029/2001GL014472, 2002.) (full text available)
These high density regions (and in these cases also high speed regions) result from large solar events pushing the solar wind plasma in front of them, forming broad density maxima.
These plots examine the solar event known as the Bastille Day 2000 CME. The solar flare and coronal mass ejection (CME) which occurred on the Sun on July 14, 2000, were the largest so far this solar cycle. The CME reached Earth on July 15 and produced a strong geomagnetic storm and widespread aurora. The first figure shows the observations from the WIND spacecraft near Earth. Solar wind speeds exceeded 1000 km/s. Since Earth and Voyager 2 are at the same heliolongitude, we predicted the shock associated with the CME would be seen at Voyager 2 in January, 2001.
The observations and our prediction based on propagating the WIND data outward using a 2-D MHD model including pickup ions are shown in the second figure. The timing of the shock arrival and the speed (V) and magnetic field (B) profiles are matched very well by the model. The density match is not as good for reasons we don't understand. This shock could be strong enough to trigger heliospheric radio emission when it reached the heliopause (the boundary between solar wind plasma and the interstellar medium); our model predicts this radio emission would be observed by Voyagers 1 and 2 in December 2001.
An animation illustrating the Bastille Day CME shock propagation from 1AU to Voyager 2 (63 AU) is available in these formats:
avi format (14MB)
Very low speed solar wind has been observed near solar maximum at Voyager 2 when CMEs are absent. The solar wind speed decreases with solar latitude near solar maximum, which is very different from solar minimum when slow, dense wind is near the equator and fast, tenuous wind near the poles. The figure shows the speeds observed at IMP 8, Ulysses, and Voyager 2 (top panel) and their heliolatitudes (bottom panel). At solar minimum near 1996 the spacecraft nearest the poles saw the highest speeds. Near solar maximum in 2000, Ulysses which is nearest the poles saw lower speeds than IMP 8 near the equator. Voyager 2 also saw low speeds, some of which is due to the solar wind slowing in the outer heliosphere as it interacts with the interstellar neutrals.
This figure shows a shock observed at Voyager 2 during October-November, 2000, which may be associated with the halo CME observed at the Sun on June 6, 2000. The top plot shows the sharp speed jump, and the bottom plot, the less clean density increase.
This plot shows an example of a Global Merged Interaction Region (GMIR). A GMIR is a region of increased magnetic field and plasma density. These are thought to be formed by a series of large CMEs compressing plasma and field ahead of them. The figure shows the first GMIR of this solar cycle. The density enhancement at 2000.4 lasts about 30 days (black line). The enhanced magnetic fields form a barrier to inward diffusing cosmic rays, so the cosmic ray intensities (red + symbols) decrease dramatically with the arrival of the GMIR.
This plot show evidence that Merged Interaction Regions (MIRs) are driven by Coronal Mass Ejections (CMEs). The density enhancement starting at 1999.4 and lasting about 30 days is a MIR. Behind the MIR was a 5.5 day period where the helium/proton density ratio is often over 10%. This large a helium ratio occurs only in CMEs, providing clear evidence that this MIR was formed by a CME compressing plasma ahead of it.
This plot shows an increase in the solar wind velocity which occurred over a seven day period. The velocity increased by roughly 10%, but no noticable change was observed in either the density or thermal speed (temperature). In the inner heliosphere velocity increases such as this tend to occur abruptly at shock crossings. In the outer heliosphere these increases are usually gradual, suggesting shocks are dissipating or perhaps modified by pickup ions.
Two great strengths of the Voyager mission are the reconnaissance of unexplored regions of the heliosphere and its longevity which allows comparison of data over almost 2 complete solar cycles. An interesting question for understanding the solar wind structure is how strongly does the tilt of the heliospheric current sheet affect solar wind conditions in the outer heliosphere.
The solar wind from near the heliospheric current sheet (HCS) is generally slow, 400 km/s, while that at high latitudes is fast, 700 km/s. If the solar wind flow were strictly radial, the percentage of fast and slow wind observed by a spacecraft would depend on the tilt of the HCS and the latitude of the spacecraft. Of course by the time the solar wind reaches Voyager's distance (now 54 AU) the fast and slow streams have interacted so the observed velocities are between the fast and slow stream speeds.
Many other physical processes may occur between the Sun and 54 AU. It has been suggested that the magnetic field pressure gradients cause poleward flow. Pickup ions dominate the solar wind pressure. Kelvin-Helmholtz instabilities may mix the fast and slow stream plasmas. With these various processes occurring it is interesting to see if the tilt of the HCS retains any control over the observed solar wind plasma.
The figure shows the plasma velocity (red line) and tilt of the HCS (black line) for the 1986 solar minimum and the current solar minimum. In both cases Voyager 2 solar wind speeds are time-shifted back to the Sun. The correlation is quite striking, although the behavior is different at the two solar minima. In 1986 Voyager 2 was at low latitude, so when the HCS tilt increased Voyager saw higher latitude, faster flow. In 1995-1998, Voyager 2's latitude is about 18 degrees South. From the bottom panel of the figure it is clear that at this latitude tilt and velocity are anti-correlated. As the tilt increases, Voyager 2 observes a larger percentage of slow speed wind and thus slower solar wind speeds. This plot provides convincing evidence that even as far out as 54 AU the HCS tilt has a strong influence on plasma velocity observed at a given latitude. Based on the most recent HCS data we can predict the solar wind speed should soon decrease.
We thank T. Hoeksema and the Wilcox solar observatory for providing HCS tilts on their web page.
Observations:
Fluctuations in solar wind velocity with amplitude 25 km/s and periods 1.6-2.4 days were observed by Voyager 2.
In 1997, two occurrences of these waves were detected, each with a duration of 5-20 days. In 1996, three similar occurrences were detected and described.
Time of Speed Oscillations
This figure shows a shock in the solar wind at 51 AU. Voyager was tracked by the Deep Space Network at the time of the shock crossing so we have good data across the shock. Shocks result from fast solar wind streams running into slower solar wind streams. Since the solar wind is supersonic a shock forms near stream boundaries. The velocity increases very sharply (in a few minutes) from 475 to 510 km/s. The density and temperature do not change noticeably when the shock passes. This is very different from the inner heliosphere where velocity increases at shock passages are associated with increases in density and pressure. This difference may be because the interstellar pickup ions dominate the pressure in the outer heliosphere.
This plot shows hourly averages of Voyager 2 velocity data. In late 1995 the velocity began an increase which culminated in the velocity plateau at 580 km/s from 1996.6 to 1996.8. We believe the plateau is comprised of solar wind which left the Sun at the time of solar minimum and the start of a new solar cycle. Stream structure disappears in the plateau, indicating that the Sun's tilt is a minimum. The increase in speed is a result of the slow speed wind region thinning at solar minimum so that Voyager is closer to the high speed polar wind.
Observations:
Fluctuations in solar wind velocity with amplitude 25 km/s and periods 2 days were observed by Voyager 2.
Three separate occurrences of these waves have now been detected, each with a duration of 10-20 days.
Interpretation:
These oscillations must be locally produced (within 10 AU). Otherwise they would be washed out as the faster wind overtook the slower wind.
Possible Causes:
A paper on these oscillations was published in Geophys. Res. Lett., 23, 1685-1688, 1996. The complete preprint is available online.
These plots show an interesting solar wind plasma structure which passed by Voyager 2 from September 23, 1995, to September 25, 1995 (Days 266-268). The top two panels show flow angles in the north-south and east-west directions, respectively. In this event the flow diverts towards the north and west (west is defined as the direction opposite to the direction the sun rotates). The third panel shows the width, or thermal speed, which is a measure of the temperature and which decreases in this event. The bottom two panels show the plasma density and speed. The density increases in this event while the velocity decreases. The cause of this feature is not known - one possibility is that the spacecraft briefly crosses the current sheet which is at the solar equator and spends two days north of the current sheet.
Energy-time spectrogram showing velocity jumps observed on March 16, 1995 (95.75). The vertical axis shows increasing energy and the horizontal axis shows increasing time. The colors represent the amount of current observed at each time and energy, with brighter colors indicating more current. The vertical colored strip (white, red etc.) is an instrument calibration, a way to test if the instrument is still working properly by injecting currents of known intensity into each detector and comparing with the instrument output. The black bars are data gaps where the spacecraft is not tracked by Earth-based antennae. The increase in energy, or velocity, is due to the passage of a shock by the spacecraft. Since the solar wind is supersonic, when two solar wind streams collide a shock must form.
Energy-time spectrogram showing velocity jumps observed on January 21, 1995 (95.21). The vertical axis shows increasing energy and the horizontal axis shows increasing time. The colors represent the amount of current observed at each time and energy, with brighter colors indicating more current. The black bars are data gaps where the spacecraft is not tracked by Earth-based antennae. The increase in energy, or velocity, is due to the passage of a shock by the spacecraft. Since the solar wind is supersonic, when two solar wind streams collide a shock must form. Above the main horizonal bar which shows the proton currents the helium ions are faintly visible.

Year 2002
mpg format (3.7MB)