C. Paranicas, B. H. Mauk, and T. H. Choo 3/12/09
Overview.
The Galileo Energetic Particles Detector (EPD) has been described in detail in Williams et al. (1992). That paper presents a complete description of the instrument. There the telescopes are described in detail along with the stepping motor, viewing angles, detectors, etc. A complete description is provided of the nominal charged particles detected by species, energy range, and sampling times. In addition tables are provided for converting the count rates to physical units, such as intensity. During Galileo’s orbit of Jupiter, between the Io encounter on Dec. 7, 1995 and impact with the planet on Sept. 21, 2003, we have learned a great deal about EPD’s functioning. This document is meant to highlight some of the additional details that are needed to analyze the EPD data along with our recommendations for data use.
1. Sensor normal operations.
The Galileo EPD consists of 2 separate sensors: the low energy magnetospheric measurement system (LEMMS) and the composition measurement system (CMS).
1.1 LEMMS.
LEMMS is a two-ended telescope with low (LEMMS-L) and high (LEMMS-H) energy heads. It is mounted on a stepping platform and when combined with the spacecraft spin, can sample the entire sky. Table III of Williams et al. (1992) describes the individual LEMMS measurement channels. In order for the count rate of a particular channel to be converted to physical quantities, such as the intensity, e.g. counts per (cm2s-sr-keV), it is necessary to know the channel’s response. It is frequently helpful to divide the functioning of the channel into the geometry factor (G), the energy passband (the nominal low and high energy cutoff of the channel), and the efficiency (ε).
Since the LEMMS A channels are total ion channels, for example, Mauk et al. (2004) have provided energy passbands and efficiencies for individual ions (H, He, O, and S), see Tables 1 and 2 below. An example of the use of the tables from Mauk is as follows. The A channels are total ion channels and the reported count rate (excluding possible contributions of penetrating background) is assumed to be equal to the sum of the foreground ion count rates for different species (further summed over their charge states). Each contributing ion species is detected with a unique energy passband and efficiency. In the accompanying table, Mauk et al. (2004) have attempted to quantify the various contributions to each channel. Ion charge states are not separated by EPD, so oxygen detected by total ion channels will possibly be a mixture of charge states. We believe these values are good for at least the first years following Jupiter orbit insertion and certainly nominal values for the entire mission.
Bias. The A0 discriminator was increased to a high threshold equal to 27 keV on day 1997-305. This was done to reduce noise and affects the nominal A0 passband.
Obscuration. Some obscuration to the C and D detectors of LEMMS occurs because of limited access to the sky due to the foreground shield, boom, etc. The LEMMS 45o FOV obscurations (see Figure 5 of Williams et al. 1992) have been approximated as follows: motor step 3 (10.11%), step 4 (68.68%), step 5 (59.4%), step 6 (82.23%), and step 7 (41.89%). This applies to channels such as DC0 and DC1. It does not apply, for instance, to the A channels, which use the other end of the LEMMS telescope.
1.2 CMS.
The composition measurement system also has a low-and high-energy end. The low energy end is the time-of-flight (TOF) system in which detections are organized by ion speed versus energy deposited into the detector. The high end is the ∆E × E end in which measurements are organized by energy loss (∆E) and total energy measured by the two stacks of solid-state detectors.
In the accompanying tables, the efficiencies are not included for the TOF channels. This is because the geometry factor and efficiency varies a lot over the energy passband. In the accompanying figure, we show the combined εG for these channels as a function of energy. Laboratory data and fits to these functions are shown. The parameters corresponding to these functions are also given in the table. The analytic fit to the data is written as,

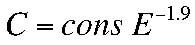
Here E is the energy in keV and the logs are base 10. We have placed an additional factor of 2 in front of εG. This was omitted by accident in the formula given in the Mauk et al. (2004) paper. However in the Mauk et al. paper, the figure plotted from this formula (Figure A1) does not require any correction.
Obscuration. The CMS FOV obscuration at the 180o end (see Williams et al. 1992, Figure 9) is as follows: motor step 4 (70.29%), step 5 (100%), and step 6 (48.83%). This affects the ∆E × E channels.
2. Corrections.
For most measurement channels, the design cannot completely remove the possibility of penetrating particles. Almost any particles can influence a detector and create a misidentification but it is the most energetic ions and electrons that are typically hard to shield out. These often contribute to the counting rates of lower energy channels. If the energy spectrum is falling off like a power law, these particles are typically much fewer in number than the particles in the nominal passband. If the foreground is high enough, these penetrators may often only contribute a small fraction of the total signal and may be less important. We strongly recommend using caution in computing intensities inward of about 15 RJ.
2.1 Effects on TOF channels.
The three TP channels are nominally measuring energetic protons over discrete energy passbands. We have found 2 problems with the proton detection in the TOF. As Mauk et al. (2004) have discussed looking at traces in deposited energy (kt) versus TOF space, the proton trace “folds over” at the upper energy end. This means that more energetic protons are being identified with possibly the correct TOF but with a lower kt. Mauk et al. put forward a possible way to correct the count rates by including, in parentheses in the table, the energy passbands for the more energetic contributions.
Looking at these diagrams for the TOF, the Galileo EPD team also discovered that the so-called “noise” in the ~50 ns TOF range, see Mauk et al. (2004), figure 7, is correlated with the flux of TP protons. These protons are likely measured with the correct kt but the wrong TOF. Many of these counts are falling into the TH bin (see, Williams et al. 1992, figure 10). We do not attempt to make a correction to that channel here.
2.2 Effects on LEMMS channels.
The lowest energy LEMMS channels (A0, A1, A2, and A3) are sensitive to solar X-rays when that end of the LEMMS sensor views toward the sun (most often in sector 7). These channels also respond to MeV electrons and these have high fluxes in the inner magnetosphere of Jupiter. Mauk et al. (2004) fit a function that describes how MeV electron counts are added to these lowest energy A channels,
Because this function depends on location in the magnetosphere, the constant has to be determined for the data in question. Mauk et al. suggest using the B1 channel, which detects 1.5 to 10 MeV electrons.
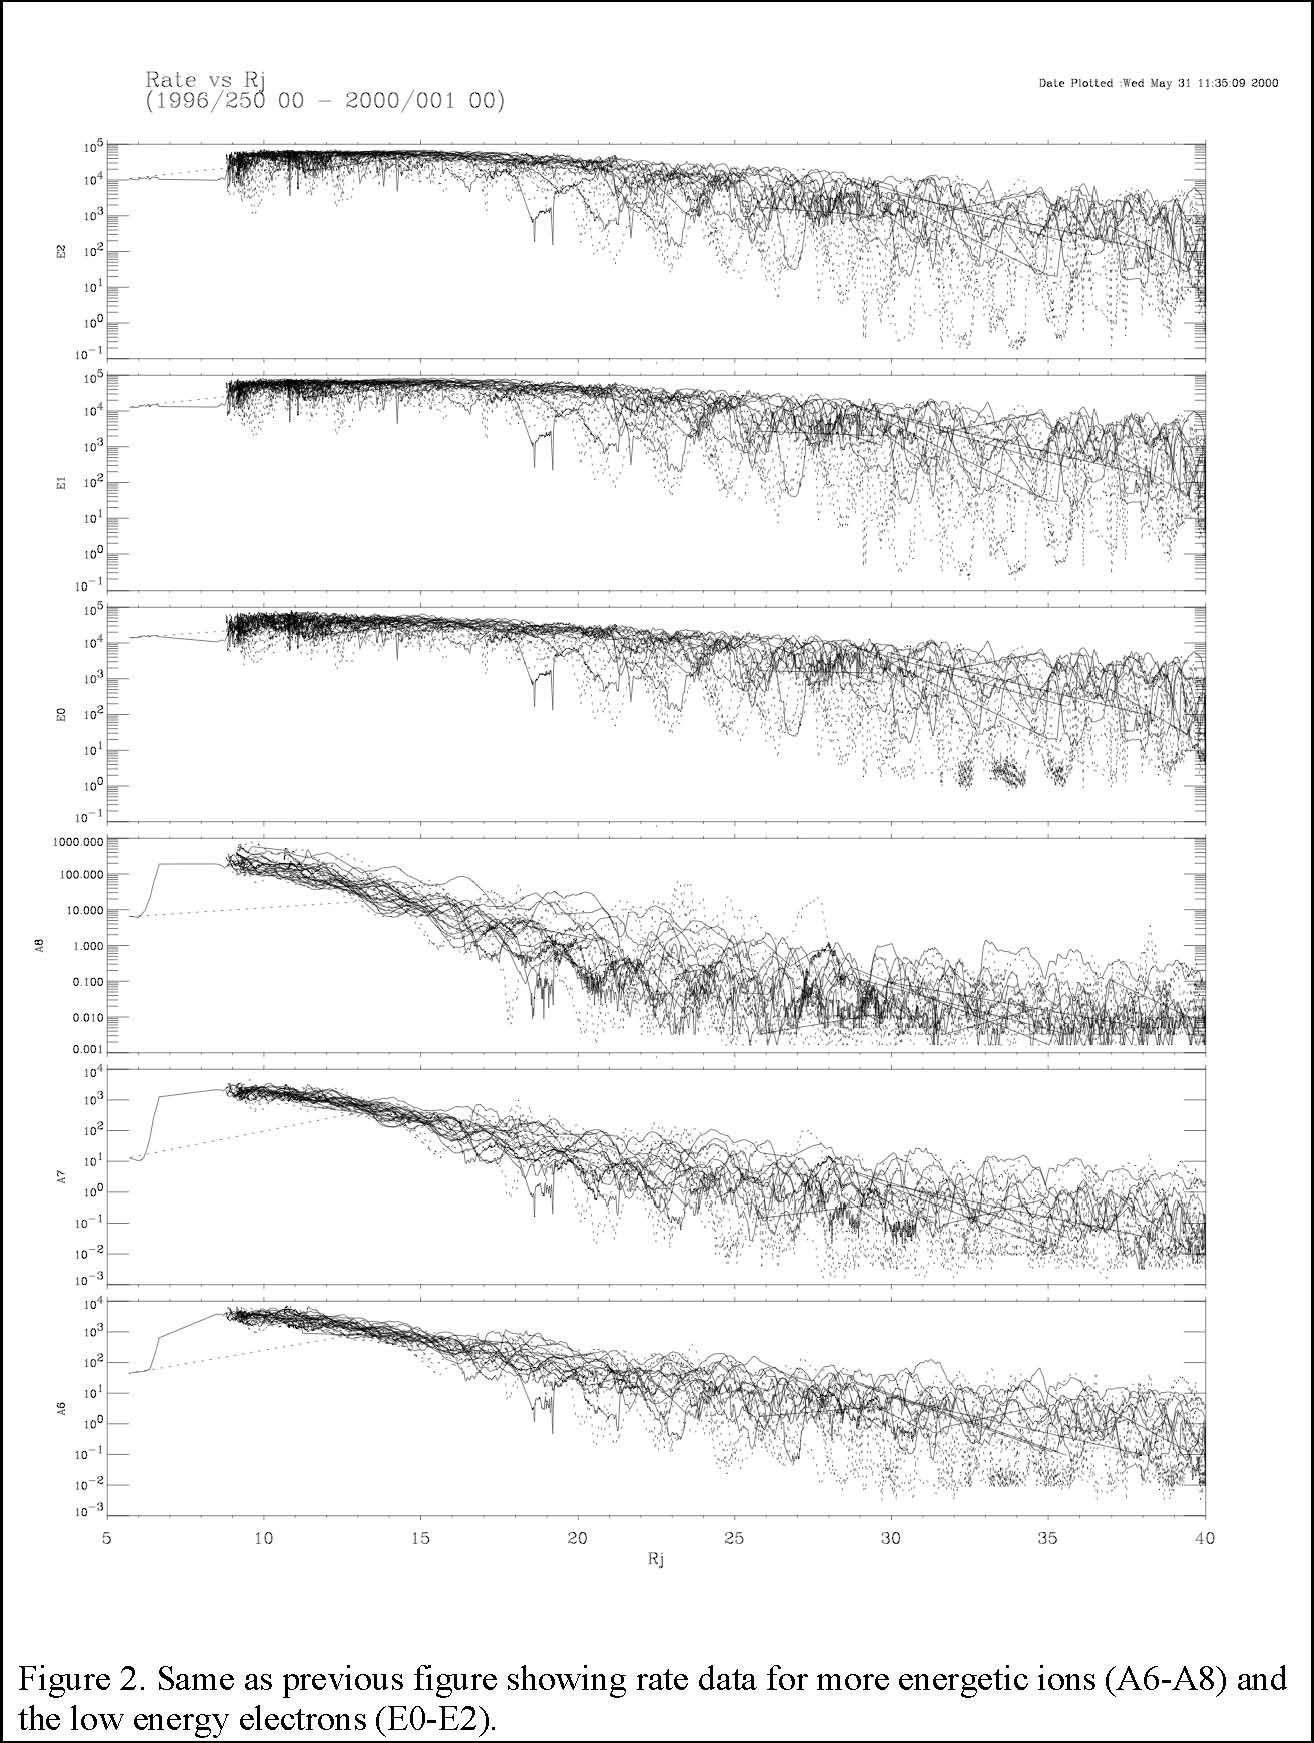
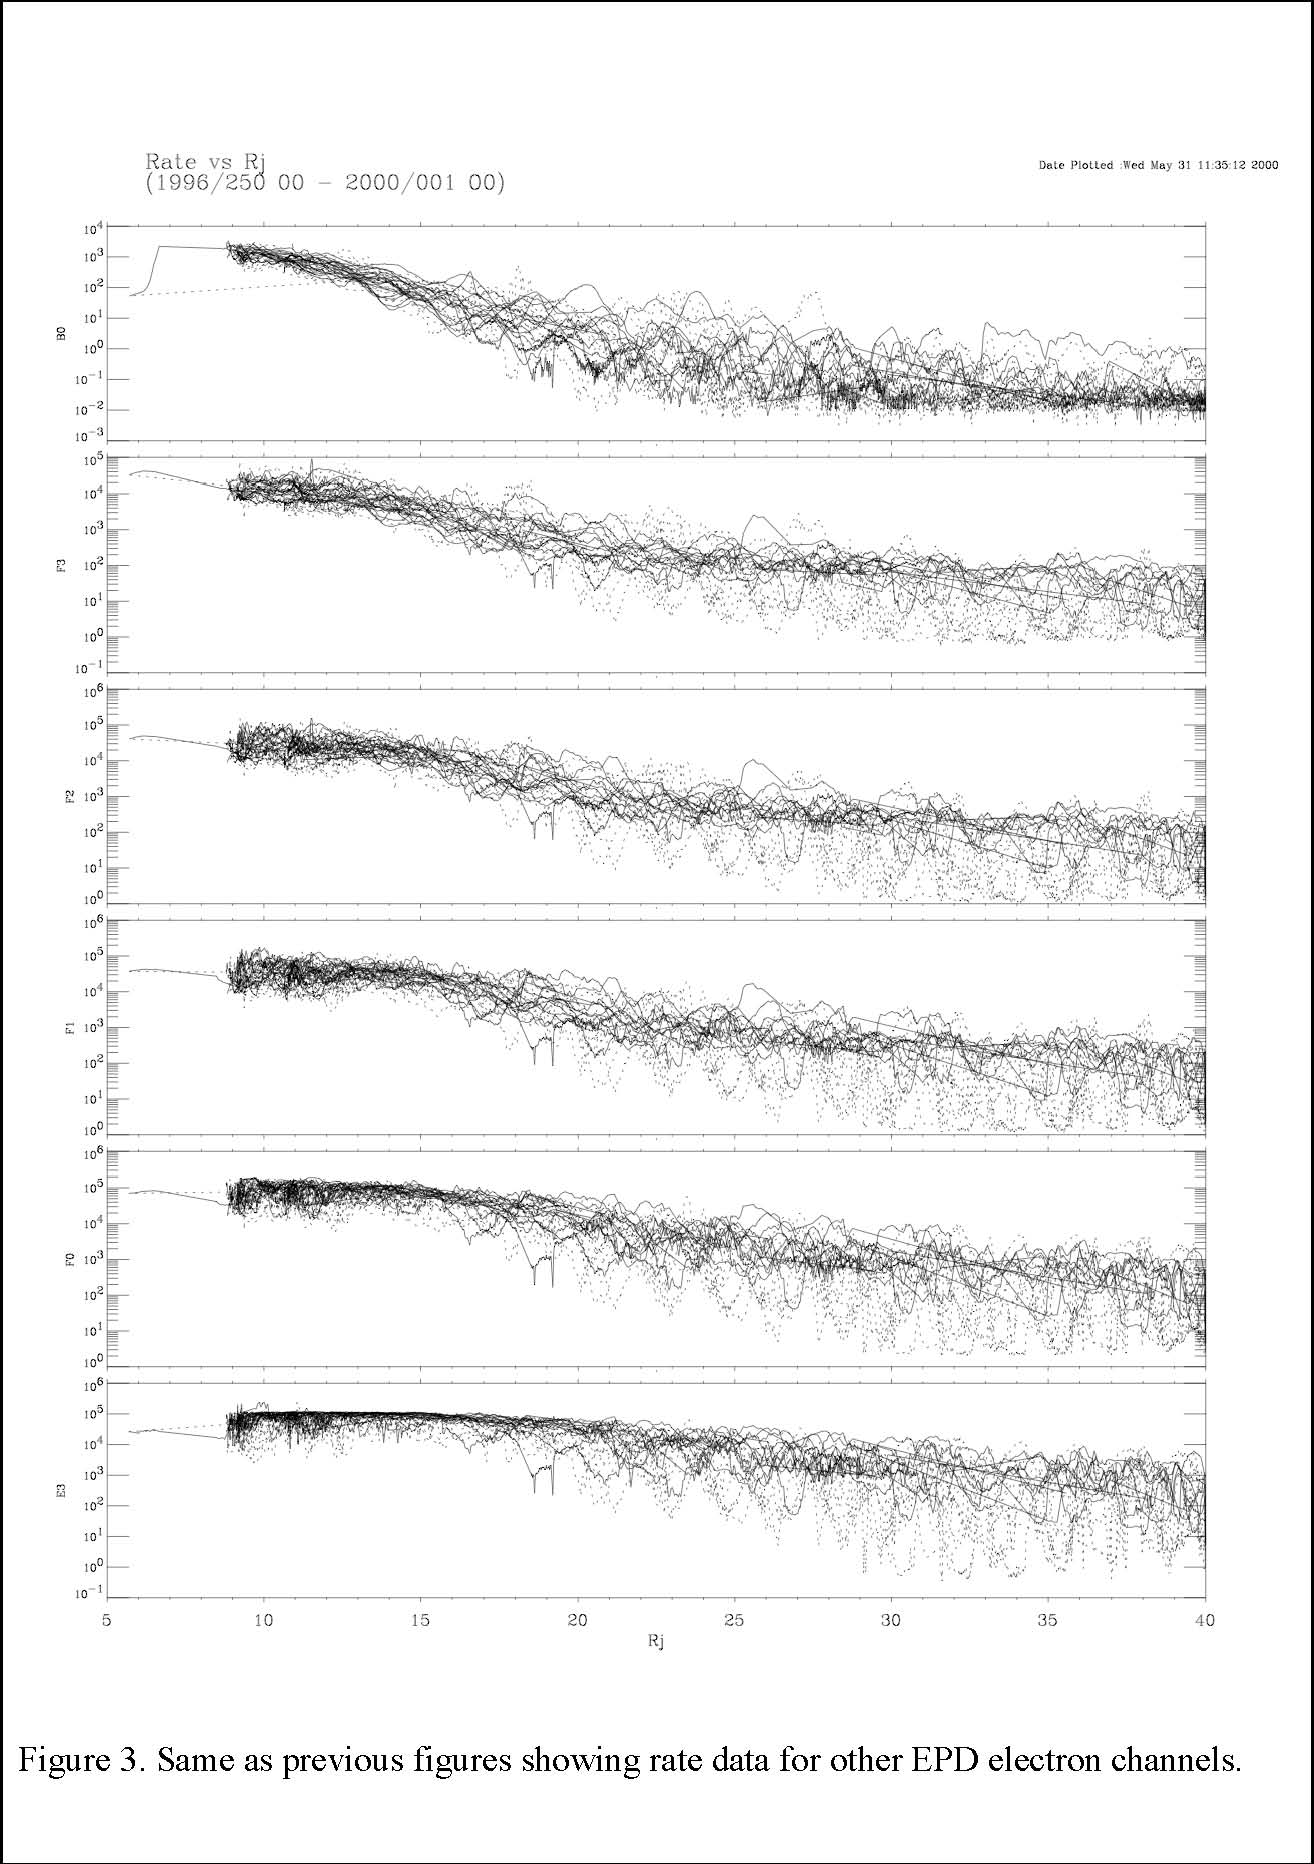
2.3 Penetrators by distance.
In Figures 1-3 below, we show data collected by the EPD channels versus radial distance from Jupiter (in RJ) for the period from 1996-250 through 2000-001. The reduction in data scatter closer to the planet likely occurs because the spacecraft is entering the dipolar region of the magnetic field. The field in the inner magnetosphere is of a higher intensity and the fluctuations are smaller compared with the total field. Additionally, the rates begin to plateau inward of about Europa’s orbit for some channels, particularly the low energy electrons. This is likely because the maximum response of the detector is being reached. The sharp upper edge of the data envelope probably reveals saturation (see the line plots for the electron channels, E0, E1, etc. inward of Europa).
For the Galileo real-time data, a rate correction has been applied, a so-called “R vs. R” correction. This is based on the formula,
Rate (corrected) = Rate (observed)/(1.0 -τ*σ)
Except for the C and D channels, τ =1.2e-06 s.
A channels: σ is a sum over A0 toA8 B channels: σ is a sum over the B singles channels C channels: σ is a sum over the C singles channels, τ = 1.6e-06 D channels: σ is a sum over the D singles channels, τ = 1.6e-06 E channels: σ = (0.5*F0) + EB1+EB2+E0+E1+E2+E3 F channels: σ = (0.5*F0) + FB1+FB2+F1+F2+F3
The formula for rate correction provided above works well when the sum of the singles rates, σ, is less than about 6.0e+05 counts/s. For the E and F electron channels, the rate frequently exceeds 6.0e+05 counts/s when Galileo is close to the planet. When σ is greater than 6.0e+05 counts/s, the rate is beyond the electronic system counting capability and the system response deviates from the rate estimation formula given above. When this occurs, we recommend that analysis should be limited to qualitative assessment and should not be used in detailed quantitative analyses.
2.4 CMS priority scheme.
The pulse-height-analysis (PHA) matrix (see, for example, Figure 10 of Williams et al. 1992) is populated sporadically. PHA events obtained on the spacecraft tend to be dominated by the most populous species/energies. Therefore a “priority scheme” is used to select a subset of the data taken on the spacecraft to be sent down. This means that the distribution in a PHA matrix (see below) is not in direct proportion to the events received on the spacecraft and should not be interpreted as such. The priority scheme used is given below. Note that the C* channels are on the prime end and the T* channels are on the TOF end of the telescope. For the corrections to the CMS channels described below, we cannot reconstruct rates that involve crossing priority boundaries since there is no way to reconstruct the relative rates in different priority designations.
Priority I: CM5 CNO TH1 or CN1 CH5
Priority II: TO3 or TO4 TS2 or CH3 TS3 or CH4
Priority III: TO1 TS1 or CM3 TO2
Priority IV: TP1 or TP2 or TP3 TA1 or CA3 TA2 or CA4
2.5 Notes on the reconstruction of CMS rates obtained late in the Galileo mission.
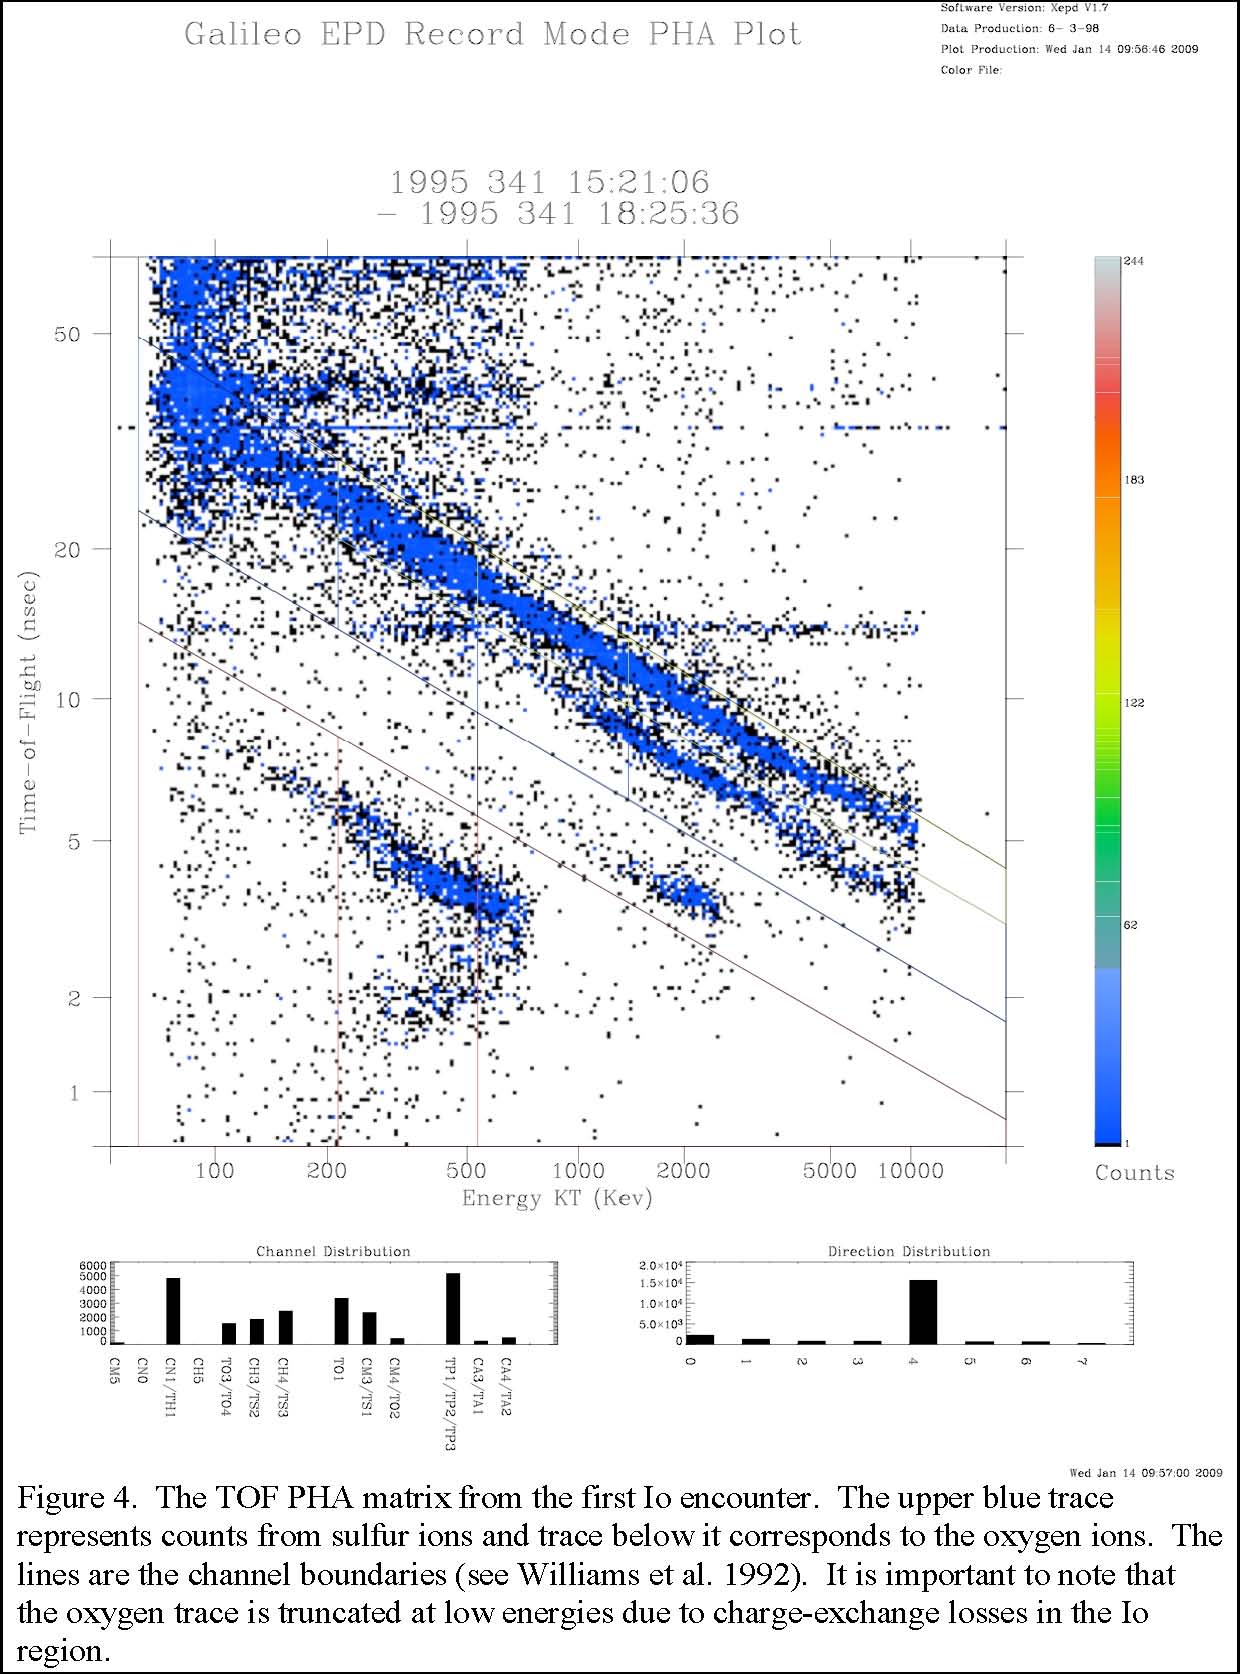
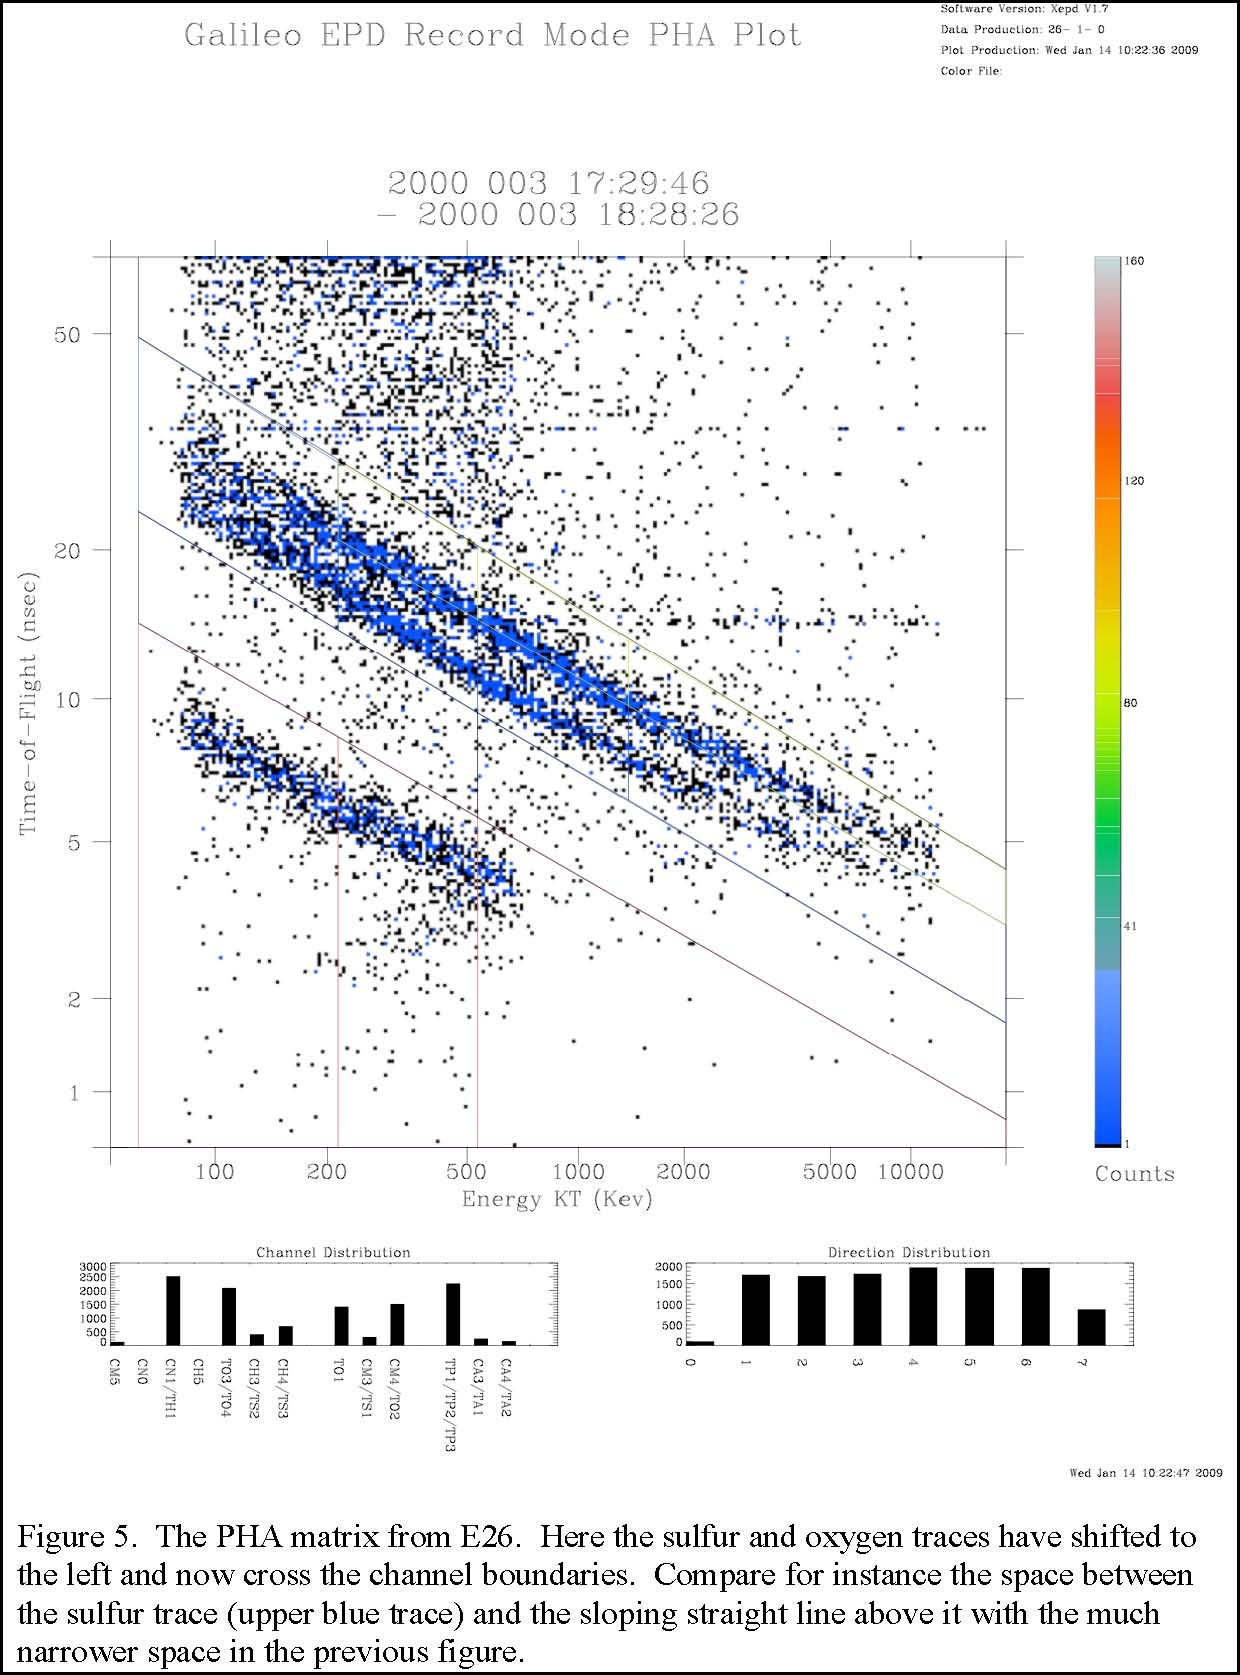
The EPD team found during the lifetime of the Galileo mission, there was some loss of accuracy in correctly assigning counts to the appropriate channels. For example, in the CMS TOF PHA matrix, it was discovered that the oxygen and sulfur traces were gradually shifting to the left over the mission lifetime (see Figure 4 and 5). It is probably the case that for the first 2 or 3 years following Jupiter Orbit Insertion (JOI), this shift was not critical and Mauk’s tables below on passbands are appropriate. For the TOF, since the time-of-flight should be intact, we believe that energetic particles are being recorded as depositing less energy in the detector than during optimal functioning. Unfortunately the shift is time dependent and there is no single correction to the oxygen and sulfur TOF channels that cover all times. Furthermore, the correction cannot be performed across priority boundaries (see above).
To correct the reported rates, one must take into account how to reassign points in the PHA matrix. For the box representing TS3, the sulfur trace is slowly moving leftward out of the box and no other traces are moving into the box. This means the reported rate for TS3 will be lower than the actual rate. To correct TS3, we assume the TOF does not change for recorded events. We then know the approximate location on the sulfur trace corresponding to the lower energy threshold of the TS3 channel. We can therefore draw a new channel box around the sulfur trace with this updated left boundary. We can then count events in the original channel box and the new box and form a ratio. In doing so, we find for the years 1997 and 1998, it is appropriate to use the approximation, TS3 (actual) ≈ 1.3 TS3 (reported), whereas by the year 2000, we suggest, TS3 (actual) ≈ 1.8 TS3 (reported). Correcting the TO4 box is more complicated because the trace is both shifting to the left and sulfur points are entering the channel box in the PHA matrix from the top. This means there are additions and subtractions to the TO4 rate that are competitive. Some channels involved, such as TS2, represent a crossing of priority boundaries and therefore we cannot perform a correction as we did for TS3.
3. Errata to published papers.
To the Mauk et al. (2004) paper.
Equation (4) is missing a factor of 2/3 in front of A to compute the pressure. The right-hand side of Eq. (4) should read, 2A/3 ∫….
Equation (A1) is missing a factor of 2 in front of the εG, as noted above. The left-hand side of equation (A1) should read, log (2εG).
4. References.
The main Web site for Galileo EPD is, http://sd-www.jhuapl.edu/Galileo_EPD/
A complete description of the instrument and more useful information can be found at,
http://galileo.ftecs.com/
Mauk, B. H., et al., (2004), Energetic ion characteristics and neutral gas interactions in Jupiter’s magnetosphere, J. Geophys. Res., 109, doi:10.1029/2003JA010270.
Williams, D. J., R. W. McEntire, S. Jaskulik, and B. Wilken, (1992), The Galileo Energetic Particles Detector, Space Sci. Rev., 60, 385-412.
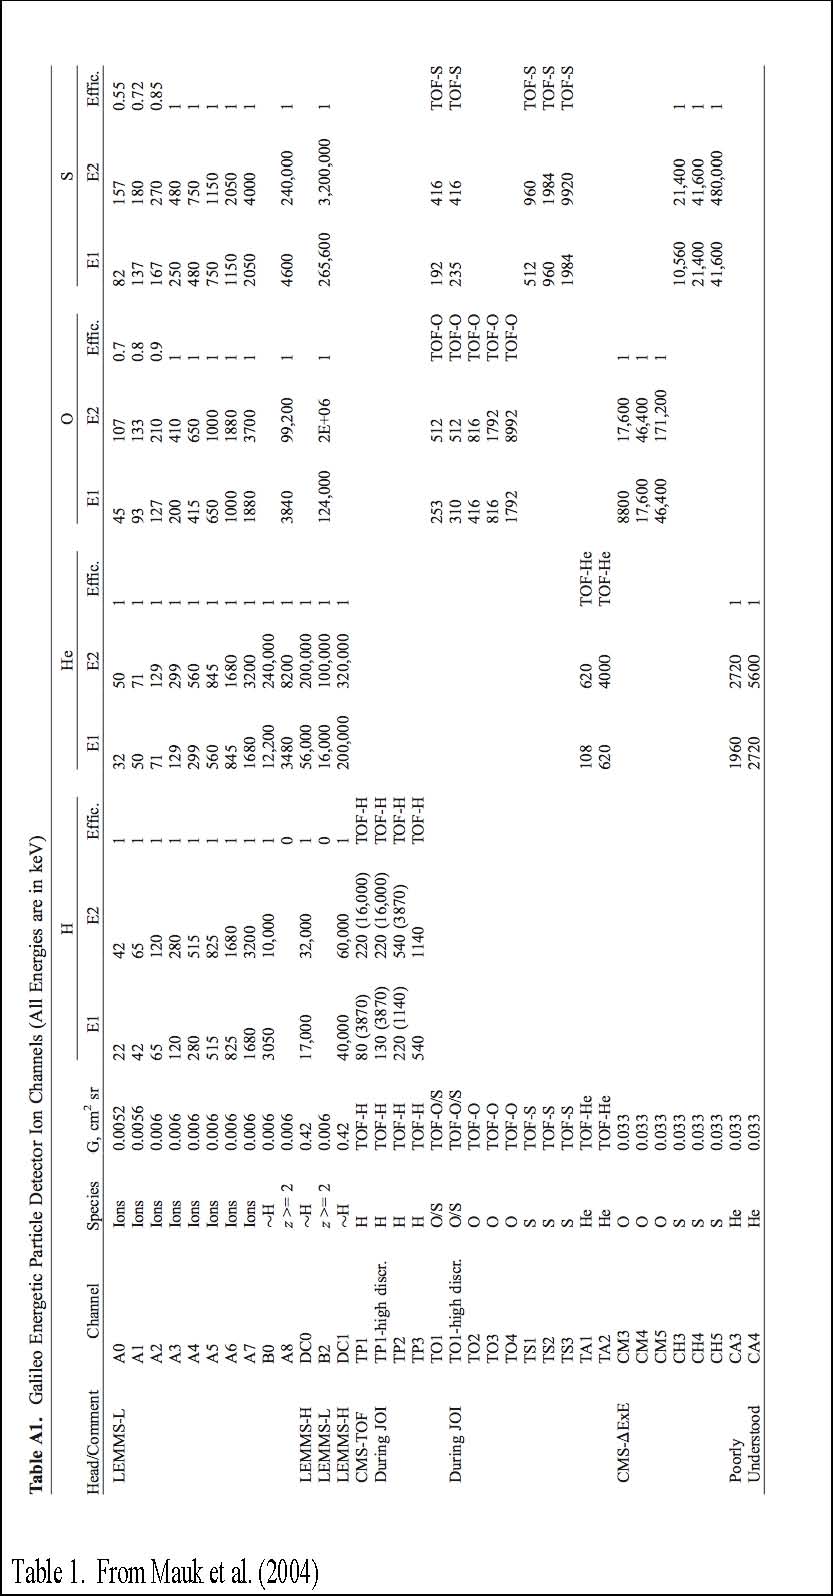
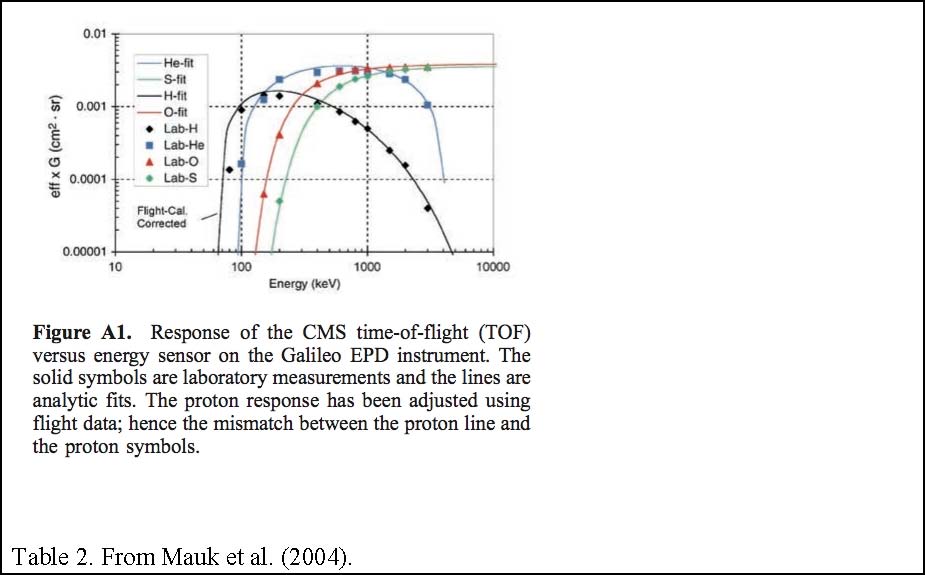
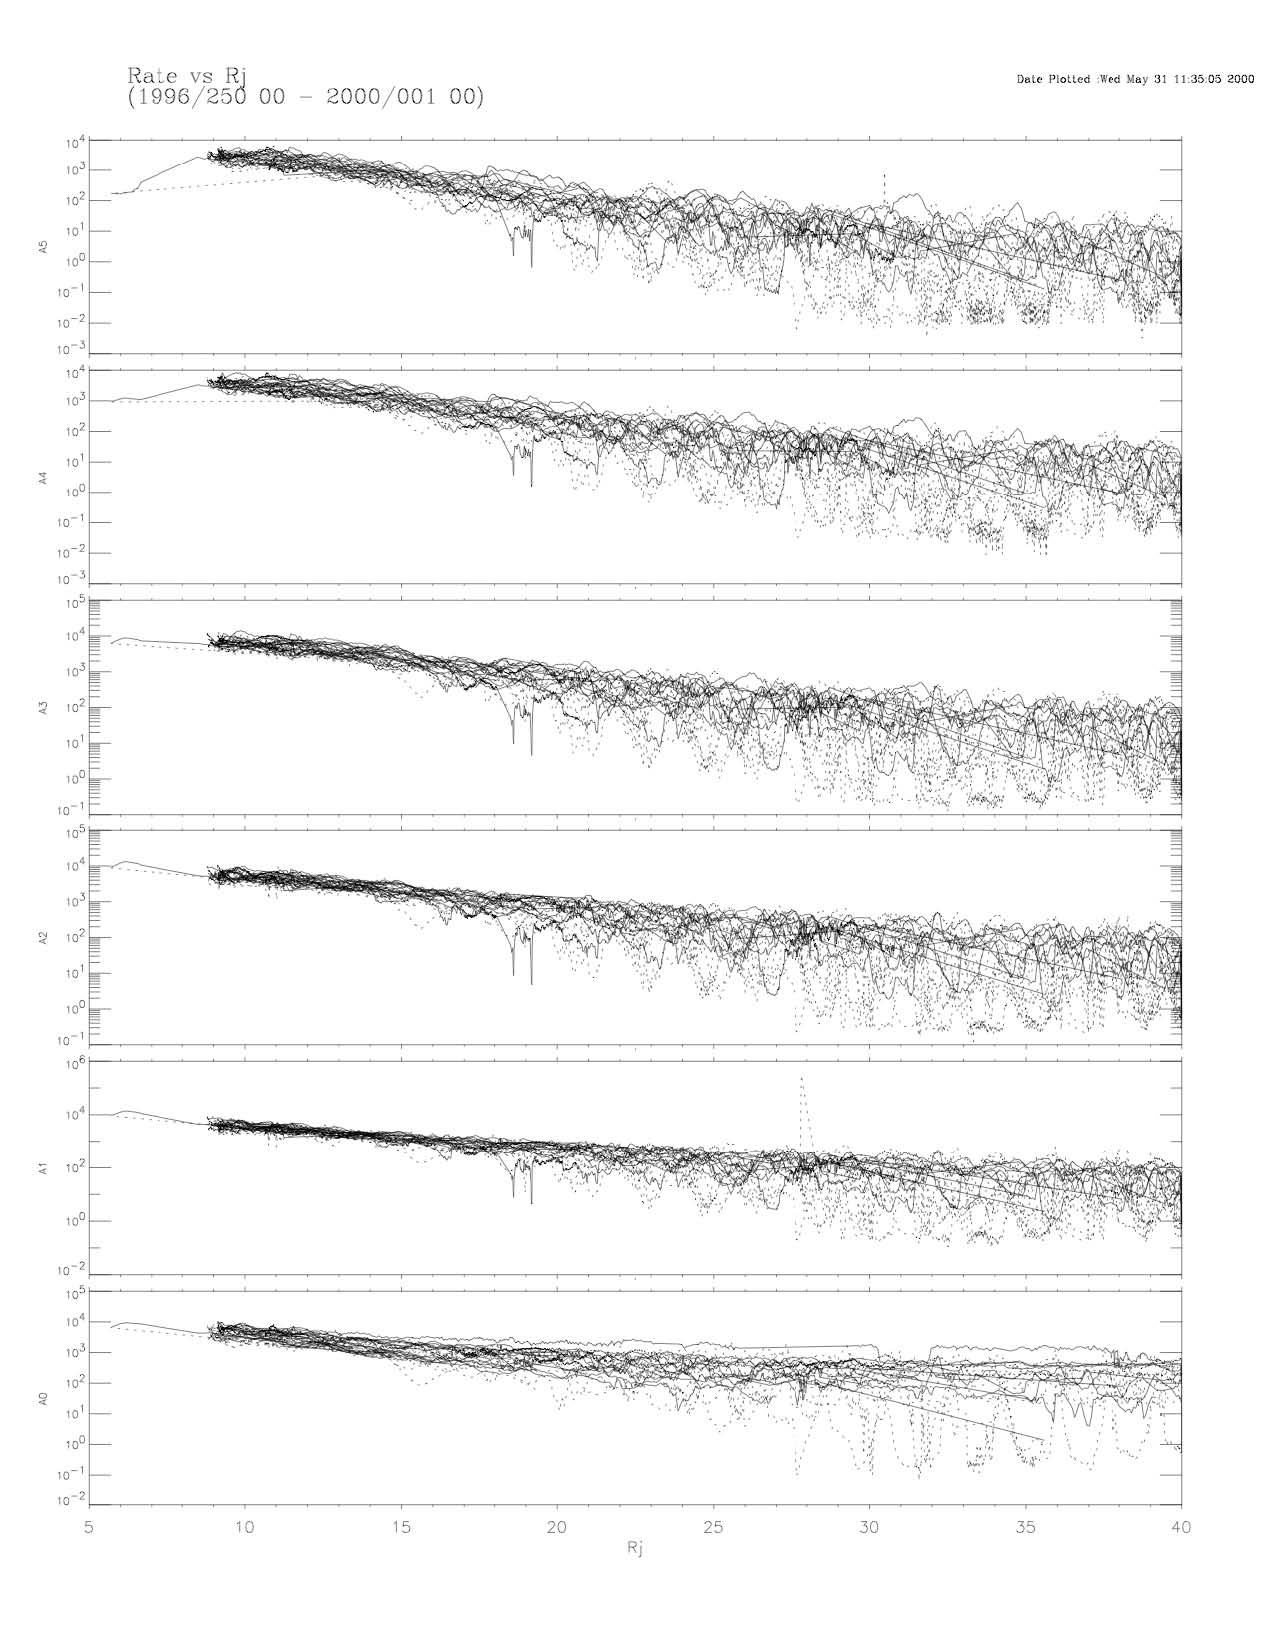
Figure 1. Rate data for the lowest energy ion channels (A0-A5) collected over times between 1996-250 and 2000-001. The horizontal axis is radial distance from the planet.